HOME PAGE
主 页
export figure survey:
ITS:395015(oct 1-10)
SGS:382826(oct 1-10)
early record / outer source
indonesian
export
tax
malaysian
monthly
statistic
Showing posts with label hedging policy. Show all posts

19 May 2009

IOICORP Q109-Q309业绩 之补充

【add 1 day later】
必须留意的是,下列的 core manufacturing profit 仅供参考。

除了欧元以外,美元因素和制造部的盈利是息息相关的,如果美元上涨,对制造部绝对有利,因为国外的制造部以美元或usd receivable记账。就因为这是有利的,所以管理层采取了卖空美元。
相反的情况也是类似。
也就是说,core manufacturing profit是不存在的。
如果对他们的对冲半信半疑,才有必要比较两者区别。
Q2的制造部亏损,是一种“必然”,也是一种“趋势”,没有必要把它adjust成“有赚”

甚至,可以把美元债务的账面盈亏,全部赖在制造部头上。因为美元债务的大小,已经被考虑在卖空美元的持仓量上了。也就是说,ioi制造部的9个月亏损,可以是-4亿,可以是-5亿。
【end of add】


【博文原文】

以下数据,是上篇博文(IOICORP Q309业绩),所作出的补充。
从中捕捉出一些可参考的数据,再加以整理。

以下所有数据,需加上'000。

第一季的要点


如上表所示,ioi的种植,制造业,和“其他”的税前盈利,分别贡献为567,109,144,749,和 81,579。

在制造业部门里,外汇亏损为-63400,因此制造业的核心税前盈利(core result),应为208,149。

美元债务账面亏损 和 “无法分类”的外汇亏损,分别为-212242 和 -37200。

综合上述,第一季core operating profit实为 801,388。


第二季的要点


第二季的亏损有多项,分别是
1)顾客违约(defaul【t】),
2)外汇亏损,
3)美元债务亏损,和
4)citibank没收的佣金。
综合上述,第二季manufacturing core profit为46489, core operating profit实为 666,739。


第三季的要点


综合上述,第三季manufacturing core profit为134,827, core operating profit实为 486,456。


种植数据 (不必加 '000)

FFB 产量cpo 平均售价
1,041,2563391
1,063,6473087
791,241 2091


其中一个结论是,manufacturing是没有forward sales的,plantation才有forward sales,但如果把cpo高价forward给manufacturing,赚幅照旧是要被“挤压”的,因此相信,ioicorp的cpo forward sales只是摆好看而已。

不像其他的公司,他们是真正forward给“外人”的。

18 May 2009

IOICORP Q309业绩


IOICORP Q309业绩大跌的4个原因。(单季,季对季而言)
1.步入低产量季节和坏天气的影响。
棕果产量下跌了26%,原因相信是季节因素(20%)和天气因素(6%)。
附加叙述:ffb产量从q2的106万公吨,下降至q3的79万公吨。

2.种植领域的平均售价走低
如果根据产量和营业额作对照,本季的每公吨cpo单季平均售价是2118,与上一季的每公吨单季售价RM3088相差甚远。
比照两个季度的plantation表现:
revenue 725761(q2) vs 494595(q3)
profit 527846(q2) vs 285524(q3)

profit change RM -242,322,(000)

若不是ioi的存货逐渐走低,相信q3的plantation revenue会更低。 当然,存货不只是plantation stock而已,它包括了finished goods。

3.美元在q3 (31 march 09)的增幅加大。
q2的美元增值不多,给ioi得到了一点“喘息”机会,但在q3,又回到了增值轨道。
本季ioi的美元债务亏损是 2.32亿, 这还不包括其他的operating currency loss。但由于之前“领教”过他的琐碎,所以这个部分暂时放在一旁。

附加叙述:去年同个时期(9个月),美元贬值给ioi带来了2亿多的盈利。

4.连续三季的高税务
由于ioi在这三季里的不可扣税亏损相当多,例如:被citibank没收的款项,unrealised currency loss等等,或许我的例子举得不够好。

ioi的平均售价真的那么重要吗?
ioi有90%++的cpo是供应给自己用的,化脂和食品部门所需的cpo是ioi园丘供应的数倍,自己卖给自己cpo,然后标明“本季的cpo售价比平均高”,得到的种植指标,反而不能在化脂和食品部门占到任何便利。
所以严格来说,ioi的平均售价不能代表整体的盈利。
由于种植部门和化脂/食品部门的业绩是相对的,我没有把化脂/食品部门列入第五个原因。

财政趋向健康。


根据上表的统计,财政趋向健康,尤以前两项最为显著。
若排除派息和回购,正现金流是能实现的,这也可以从这次的3sen股息找到一些迹象。

总体而言,这不是ioi的世界末日,相反,这是很好的买进机会(如果它一开市就大跌)。大户在骗你抛售的可能性是存在的(50-50)。
但这个发生几率是相当低的,因为,一大早,就会有一大堆分析报告“护驾”了。如果他们口径一致是建议售出的,就能买进。
当然更重要的是,几时才调整?
以这一波小牛的操作概念来说,只要cpo/plantation index/sbo没有出现deviation(背离),就是安全的。
什么样的情况是背离?例:
sbo一天涨8%,但cpo原封不动,甚至说plantation index是下跌的,那就是背离了。
或:cpo一天涨8%,但sbo原封不动。
或:综合指数一天涨5%,但cpo原封不动。
当然近期的成交量也可能是一种背离,“预警”着下一波的调整即将来临。
我不会预测未来,上述的例子只能给你参考。

【9.00am 评论:先留意分析报告的意向才决定买不买吧,我不想背负罪责】

07 January 2009

期货和现货,乖离显现

我不常看期货走势,因为期货比较容易受人摆布。这两天期货站上了RM1950-RM2065的水平,但是对于比较热络的现货市场(physical dilivery),今年至今的现价却是RM1722到RM1800之间。

我国的期货规模太小,月头的走势比较容易受人摆布,只有在结算的时候才能显现和反映真实价格。

即使是石油期货也不能摆脱别人的摆布。


cpo期货的整理

每单位:25 tons cpo
如果"short"(买跌)1 lots的RM1800 cpo期货,万一他是涨的,承担的亏损风险是无穷的。
如果"long"(买涨)1 lots的RM1800 cpo期货,万一他是跌的,承担的亏损风险最高是RM45000。(但是他不可能跌至0)

按柜金:没印象。可问你的期货经纪,应该RM8000或更低。按柜金率常常改。

停板机制(当月货不受限制):
很复杂,不便赘述。
简单来说,只要有3个"月货"出现10%差距,所有月货(除当月货)必须冷却10分钟,停市5分钟。
15分钟后,限制是15%,直到闭市。

当月期货(spot month):只能交易到当月的15号。例如说【jan2009 fcpo】只能交易到15 jan 2009,其后的的结算需视场外竞标结果决定。如果15日是假期,推前一天。

竞标地点:port klang, port butterworth,port pasir gudang,参与的seller必须得到品质鉴定才能把cpo注入封箱(tank)中。相信每个箱子重25tons。

tank owner相信是中介人,他必须与期货当局和交割所联系。

结算日为当月20号,如果是假期,推前一天。

竞标者必须承当品质鉴定费,cpo tank installation cost,和保险费。


从以上整理可以看出,港口竞标和期货市场不能完全用来显现在真实市场里。因为大型公司多以买卖合约来交易cpo,不必拐个弯把cpo送去竞标。

再来看这个2008年的港口交割数(source : http://mytradersview.blogspot.com/


全年港口竞标和交割的cpo总数,是12277 x 25tons,这只占总出口的2%多一点。


我们不应该看到期货上涨就赶紧冲进市场买进,尤其是短线交易,很容易中箭身亡。
还需要做的是,看看mpob今天早上的ffb卖价。

但很确定的,cpo在上涨中。
只是,RM2000的期货闭市价到底是不是大户用来“诱猎”散户的数字呢?
长期投资没有错,但如果我们能躲避数次的剧跌,是不是更好?

我不敢预测短期内股市会怎样,因为走势真的是瞬息万变和扑朔迷离。即使要预测,我也会软化立场,并附上“买卖自负”等声明。

01 December 2008

hsplant figure

production

no.periodffb(mt)cpo(mt)pk(mt)
12007,07Sep-2007,31oct146917.4732006.17044.63
22007,01nov-2008,31jan211876.5344112.99942.37
32008,01feb-2008,31mar103087211254945
42008,01apr-2008,31jun167905355907829
52008,01jul-2008,31sep193994415228999


sales volume and sales price per tons

no.sales cpo(mt)sales pk(mt)cpo price/mtpk price/mt
130356708621671562
2484231019622891739
313252490624311995
440762585725731931
5443651095722961581


financial figure('000)

no.revenuepre-tax profitinventoryreceivable
180900465002412815076
2135647734892133122566
345800176492708913637
4123433557332221653780
5125509620234069724756


Hsplant上市以来经历了5个quarter,其中两个quarter不是完整3个月。
从上表中可以发现,虽然Hsplant的销售极不稳定,但是不足(deficiency)的地方很快就会被下一季填补。
例如no3的销售因为延迟出货,业绩少得可怜,但是他很快的在下一季填补。
例如no4的receivable突然增加,但此现象在下一季也得到了填补。

至于no5的存货增加原因,尚不明确。

目前有一半的CPO是以RM2000++ 销售的,比较了现在的CPO,可说是暴利。
但是年头的时候,他也是以RM2000++销售。

肯定有人(像我一样)觉得,增持hsplant不如增持hapseng,这是对的。
但如果万一hapseng破产,他会分给你hsplant股票吗?
答案是不会。
所以他们的估价(股价)主要是风险因素,sum-of-the-part倒是其次。
hsplant的风险接近free,所以他应该享有同行业的溢价,他更应该比hapseng贵一个价位。(在风险+金融海啸的环境下)
如果你不在乎风险,那么hapseng比hsplant更值得拥有,这就是对的理论。

或许我们会认为,这种公司太过稳定,股价起伏肯定不会太大。
但是从这次下跌风暴来分析,稳定性和股价起伏是没有连带关系的。
IOI够稳定吗?还不是一样大起大落。

这不是买入建议。

08 November 2008

IOI Corporation的本季成绩“尚可”

RM290,500,000的单季盈利是不幸中的大幸,这是中立说法。
但账上盈利不是真实的盈利,如果公司的公告说明属实的话,那么本季的盈利是不错的。


IOI记入帐目的外汇亏损主要有以下1)和2)两个部分:
1)以美元定价的债务:美元增值对IOI不利,当季亏损是RM212.2 million。
2)以外币定价的交易:欧元贬值对IOI不利,美元增值对IOI有利,当季亏损是RM100.6 million。
3)其他,新元和日圆债务:没有记入帐目。

1)和2)总亏损是RM312.8 million。


要解决以上问题,就必须执行“对冲”。
由于对冲商品在结算日以前的盈利或亏损都不被记录,因此本季的IOI外汇亏损只单是外汇亏损而已,他们并没有记入对冲盈利(也可能有,只是不确定)。
近月外汇相当动荡。例如中信泰富,因为澳元大幅下跌而蒙受20亿美元对冲亏损,在韩国也有个案。
和中信泰富不同,IOI的对冲(在三个月内)是赚钱的。(如果文告属实)
这是因为IOI每季都会签新的contract,对冲美元债务和欧元贸易,这些contract期限从3个月到4年不等。
举一个例子,如果他在2008年7月签了份有利于他的contract,不管他赚了多少都不能记入盈利,如果他没有到期。

随着营业额增加,IOI也同时增加了对冲的仓位。在currency的部分,从去年度的39.58亿仓位增加到2008六月的53.06亿仓位,之后迅速退到2008九月的45.34亿仓位。

虽然在9月份他的Forward foreign exchange contract仓位大量减少了,但是他们却签了另外一种contract--Structured foreign exchange contract
我对这类的Structured商品是高度怀疑的,这是因为此类商品是OTC(over the counter)完成,欠缺透明度,而且可能有不公平的条款,例如limited gain, unlimited loss.


【edit lately on 17 april 09,由于对这产品过于生疏,很多说错和说漏的地方已无法纠正,如果想了解这类结构商品的细节,可阅这个较新的分析


Currency target redemption forward contract,是属于新型的结构商品,相信是从target redemption note衍生出来的,看来这至多是两年而已。

文中出现的“reputable banks”,意义上再清楚不过了,IOI拒绝透露和谁签(或者是该银行拒绝透露)。
但我相信这是Citibank或Hsbc兜售的,这是因为中信泰富也有向他们签。

USD/MYR Target Redemption Forward为例。
USD/MYR越高(美元增值),对IOI有利。
USD/MYR越低(美元贬值),对IOI不利。
但不要忘记,或许他附带了limited gain, unlimited loss条款。

除了以上的currency contract以外,尚包括Interest rate swap contracts和Commodity contracts,但仓位不大,因此不述。

美元债务亏损说明补充
US/RM rate
06/30/2008 3.259
09/30/2008 3.453
美元增值 5.95%
美元债务:1120093000美元


IOI已经变成高度依赖leverage的企业,人事变动和商品冷却的打击,令到她的financial control“序中有乱”,股价也走火入魔,我也极不认同他的buy back scheme。
投资,要看他还能不能相信。
投机,小赌怡情。

我不相信业务涵盖上中下,打击是最小的。
如果我们拿出2007和2008的manufacturing-based的成绩比较,答案已经否决了。

01 October 2008

为什么thgroup要被私有化?

很简单的问题,thgroup的业绩向来都不好,即使是2008年前半年,cpo行情大好也到达不了个位数本益比,那么为什么大股东还有那么多的钱收购他?


thgroup的业务领域很广,有
1.Plantation
2a. Contracting services & 2b. Construction
3.Venture capital
4.Information technology
5.Investment holding
6.Money lending
7.Biohealthcare
8.Others

8个项目里,只有plantation是赚钱的。
2a和2b亏损比是最大的,其次是5,悲观预测,这些亏损是60millions/year in FY2008,但这已包括利息成本。

这也就是说,plantation的净利必须超过整亿(扣税扣利息)才能覆盖掉亏损额,不然的话75sen per share的估值就太高了。

但是从2007年和2008年前半年的记录来看,plantation performance根本就到不了target,这是怎么了?

简单的结论,有人偷吃?

th group的种植面积是11500公顷,由于90%都在prime age,平均年产量为28mt/ha,如果以市价变卖,这些地段应该在RM350millions以上(尚且忽略他的地段是属什么title的)。但是th group并没有重估这些biological asset,因此他的帐面是缩水的。

2007年的总体行业平均售价是RM2400-RM2600 per mt cpo,但是th group的平均售价却是RM1893。
2008年首半年的总体行业平均售价是RM3400,但是th group的平均售价却是RM2822(Q1)和RM3176(Q2)。
他们的pk是spot price销售的,这是一般公司用hedging policy的普遍现象。

如果把cpo销售提高RM500,那么profit before tax就少算了RM35millions。
而且尚不包括cpo from milling selling price,如果考虑这点,折价恐怕有RM650 per mt以上。


因为局势不妙,大股东就因此趁火打劫了?

你认为Lei Lin Thai是出手大方的人吗?

27 September 2008

Three-day gains in crude palm oil boost Tradewinds Plantation

http://biz.thestar.com.my

PETALING JAYA: The share price of Tradewinds Plantation Bhd (TWPB) jumped 10.9% or 28 sen to RM2.84 on Friday and was the second biggest gainer in percentage terms in the KL Composite Index.

This is attributed to a third-day gain of 11.4% by the crude palm oil (CPO) futures, which ended the week at RM2,715 per tonne.

The CPO price has tumbled 11.4% this year and 35.7% from its all-time high in March, while TWPB’s share has fallen 28.3% this year.

Aseambankers said although TWPB’s net profit jumped 947% to RM87.2mil in the first half of its financial year ending Dec 31, it was still below the research unit’s expectation.

The group’s fresh fruit bunches (FFB) production was unexpectedly low at 252,800 tonnes, while the production cost was high at RM1,877 per tonne.


For second half this year, Aseambankers expects TWPB’s performance to improve due to seasonally high production months and locked-in sales of over RM3,000 a tonne.

However, its operating profit could be offset by higher fertiliser costs and weaker CPO prices.

In addition, there are concerns over the spillover negative effects of related transaction involving MMC Corp Bhd and the controlling shareholder of TWPB.

Aseambankers forecast the average CPO price for FY08 and FY09 would be about RM3,000 and RM2,500 a tonne respectively.

AmResearch, in a report, said it remained cautious on TWPB’s performance due to the uncertainties in the CPO prices.

It believes global demand growth could not catch up with supply, while the downward trend in CPO prices could be a further drag on vegetable oils.

AmResearch also said the Government expects biodiesel exports to rise 50% to 143,000 tonnes this year as the lower palm oil prices has made biodiesel viable aagain.

Citing Plantation Industries and Commodities Minister Datuk Peter Chin, the research house said this was subject to CPO meeting the demand for vegetable oils before the excess can be used in the energy sector.

Malaysia's Kim Loong Says Crude Palm Oil Price Downtrend Temporary

http://www.mysinchew.com

2008-08-27 23:45

KIM LOONG RESOURCES is optimistic that the current downtrend in crude palm oil (CPO) prices will not hurt its profit for FYE Jan 31, 2009. Executive Chairman -GOOI SEONG LIM said the Company had locked in 25% of total CPO production up to Dec 2008 at RM3,400 a tonne and was not under pressure at this juncture.

He said even if CPO price were to drop to below RM3,000 a tonne and sustain for six months, its overall average price would still be relatively higher than RM3,000 this financial year against RM2,500 last financial year.

With a relatively tight national palm oil stock and uncertain soybean production, coupled with poor weather in the US, the tight vegetable oil supply would push CPO price back to its high.

Asked if KIM LOONG would further lock in its production, GOOI was quoted in the STAR ONLINE on Jul31, 2008 saying that " .... we will not sell below RM3,000 per tonne and do not think it's necessary as the CPO price downtrend is unlikely to stay ....".


On its diversification into the palm nutraceuticals project, which involves the extraction of tocotrienol concentrates (a vitamin E concentrate), he said KIMLOONG was currently busy building the distribution network to market the product, adding that the current production capacity of tocotrienols at its Kota Tinggi plant in Johor was 3,000 tonnes per year.

They hope to find a niche market for tocotrienols in Japan, the U.S. and China. The Company also plans tosell in bulk to local pharmaceutical companies with strong networks.


NEW SOLVENT EXTRACTION PLANT FOR PALM KERNEL
Meanwhile, KIM LOONG is investing RM10m each in a new solvent extraction plant for palm kernel in Kota Tinggi and another for fibre oil in Keningau, Sabah,for its downstream business.

On Dividend payout, GOOI said KIM LOONG had paid out 23 sen per share for FY09 to date, higher than its total dividend of 18 sen per share for FY08.(By KLSETRACKER.com)

18 August 2008

asiatic 12 August 2008

Asiatic Development Berhad
12 August 2008
downgrade to hold (from BUY)
Price RM5.90
Market capitalization RM4,455 million
insider asia Analyst Linda Koh
Company/Sector Update

Key stock statistics 2007 2008E
EPS (sen) 45.6 57.2
P/E (x) 12.9 10.3
DPS (sen) 14.0 17.0
NTA/share (RM) 2.71 3.16

Issued capital (mil) 756.2
52-week price range (RM) 4.80-9.40

Major shareholders (%)
Genting 55%
EPF 7.4%

 Year-to-date CPO production outpaces demand growth
 Downward momentum likely to persist in near term
 Bearish sentiment for plantation stocks
 Downgrade to HOLD – longer-term fundamentals intact


Share Price Chart


The outlook for crude palm oil (CPO) has turned distinctly bearish in the near to medium term.

After averaging at around RM3,485 per tonne for the first seven months of the year, CPO prices tumbled sharply in the past month. Benchmark futures contracts traded on the Bursa Derivatives are currently trading well below RM2,600 per tonne.

The fall was triggered by sharply lower crude oil prices. After rising to all-time record high of US$147 per barrel in mid-July, crude oil futures on the New York Mercantile Exchange are now hovering around US$113 per barrel, down by some 23%.

This latest price retreat was fuelled by concerns that the slowing global economy will hurt demand. There are nascent indications that oil consumption in the US is starting to slow while China reported lower imports in July. The US and China are the world’s largest and second biggest oil consumers, respectively. A stronger US dollar has further accelerated the fall in crude oil prices and most other commodities.

Cheaper crude oil prices translates into less financial incentive to produce alternative biofuel, for which corn and other oilseeds including CPO are used as feedstock.

There were also some concerns that mandatory biofuel quotas in the US and Europe could be suspended or delayed. Usage of food crops to produce biofuel has been blamed for rising prices for food worldwide.

On the supply side, global crop production outlook has also improved with more favourable weather conditions. The recovery in stockpiles for many edible oils has weakened prices further.

Malaysia’s production of CPO has been rising at a faster pace than demand, so far this year. CPO output up to July increased by some 21% y-y to 9.76 million tonnes. Exports, on the other hand, have grown by a lesser 16% y-y to 8.33 million tonnes during the same period.

As a result, stockpiles have grown – to as high as 2 million tonnes in June. Stock levels were pared back slightly to 1.98 million tonnes in July on the back of higher exports. However, it appears that the momentum for CPO remains downward biased, for now.

While global consumption of edible oils should continue to grow at a steady pace, expectations of double-digit CPO production growth in 2008-2009, could keep stock levels high.

Looking further ahead, much will depend on the direction of crude oil prices, weather conditions that could affect planting and harvests as well as the strength in demand.

For instance, we may see renewed stocking up by buyers if CPO prices continue to slide, especially heading into the later part of the year where demand is seasonally stronger. That would help pare down existing stockpiles.

Cheaper crude oil prices will reduce the incentive to produce alternative biofuel. On the other hand, lower feedstock prices could also revive stalled biodiesel programs. While CPO prices remain high, these projects are economically unfeasible.

So far, the government has issued more than 90 biodiesel licenses, with total production capacity of up to 10 million tonnes. However, recent reports indicate only 12 plants, with capacity totaling 1 million tonnes, are currently up and running – and most are operating at well below capacity. Total output this year is estimated to be less than 100,000 tonnes.

At lower CPO prices, utilisation levels could trend higher. Also, the US Environmental Protection Agency recently rejected calls to suspend a federal mandate on biofuel, which requires the usage of 9 billion gallons in renewable fuels this year. The mandate increases annually to 36 billion gallons in 2022. This bodes well for the biodiesel industry.

a comment: it should be denoted by US gallon,which equivalent to 3.785L

We have previously assumed CPO average selling prices of RM2,800 per tonne in 2009-2010 in our earnings forecast. We are keeping these assumptions for the moment, while waiting for prices to stabilize.

Impact on Asiatic Development
Falling CPO prices are expected to weigh on earnings for most plantation companies, including Asiatic Development.

The company sells most of its CPO in the spot market. Thus, the drop in CPO prices will hurt earnings in 2H08. (hedging policy)

We have lowered our average selling prices for the year to RM3,100 per tonne, from RM3,300 per tonne, after taking into account the current price drop. This shaves about 8% off our earnings forecast, to RM432 million in 2008. Going forward, we are keeping our earnings pretty much intact, for now.

Given the prevailing bearish sentiment, its shares appear fairly valued at roughly 10.3 and 11.9 times our estimated earnings for 2008-2009. Hence, we are downgrading our recommendation from BUY to HOLD. Sentiment for plantation stocks as a whole will likely stay weak.

The company’s underlying fundamentals remain intact. It is sitting on net cash pile of some RM524.3 million at end-1Q08. Asiatic new land bank acquisitions and planting up in Indonesia will underpin growth over the longer-term. Its biotechnology venture should also yield returns beyond 2012.


08 July 2008

A Look at the Big Four Global CPO Players

20 June 2008
gan-huey-ling@ambg.com.my
Investment Highlights
We affirm our Overweight stance on the plantation sector with unchanged CPO price assumption of RM3,500/tonne for 2008 and 2009. Our bullish conviction is premised on the good margins enjoyed by the upstream and downstream plantation segments and earnings convergence from CPO production and acquisitive growth. In this report, we highlight the investment and operational attributes of the four largest plantation companies under our coverage i.e. IOI Corporation, Sime Darby, Wilmar International and Indofood Agri-Resources. These four companies collectively account for 15% of the world’s CPO production.
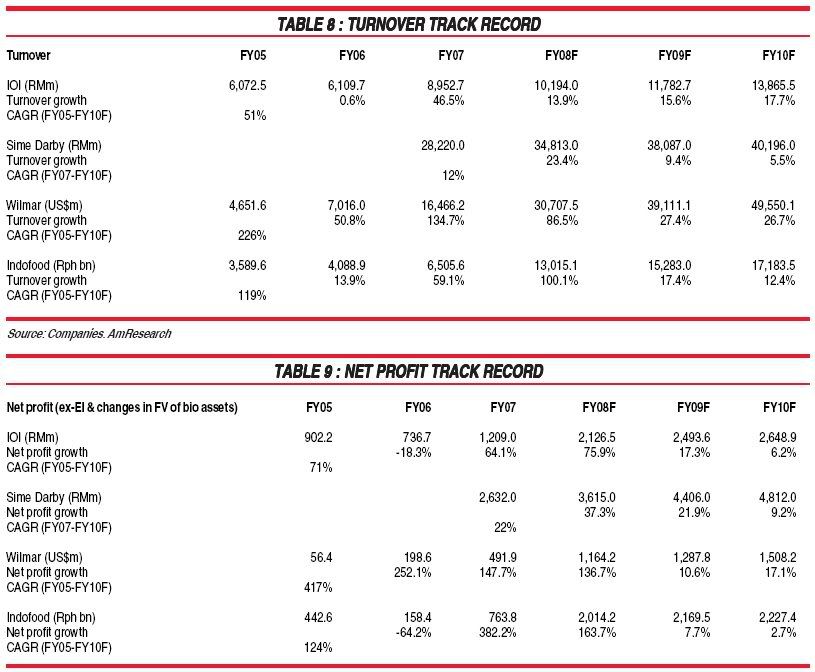
In the upstream segment, IOI is the undisputed leader. This is because of its sterling FFB yields of 26 tonnes/ha to 28 tonnes/ha and efficient operating costs, which are consistently below the industry average. However, in the longer-term we believe that this may not be sustainable as IOI’s prime trees would start to age while contribution from the Indonesian estates would take time to be significant. Instead, we believe that in three to five years’ time, Wilmar and Indofood would demonstrate the strongest rate of production growth due to the young age profile of their oil palm trees. We estimate the CAGR of FFB output of Wilmar and Indofood from FY08F to FY11F at 7% respectively versus IOI’s 2% and Sime’s 3%.
In the downstream segment of refining and specialty fats, margins have expanded because of good market timing, strengthening demand and improving selling prices. Going forward, we expect demand and refining margins to remain positive although growing at a slower rate. The growth is driven by supply disruptions caused by unfavourable weather and organic factors such as increasing population and urbanisation. Wilmar would be the main beneficiary due to its large economies of scale in Malaysia, Indonesia and China and good track record in reading the commodity markets.
In the specialty fats segment, we believe that IOI is well-placed to take advantage of growth opportunities. Demand and operating margins are expected to improve underpinned by structural changes in USA. Increasingly, palm oil-based products are gaining acceptance in the country as more cities e.g. New York ban the use of trans-fats in restaurants and more consumers are aware of healthier alternatives. Although food inflation is a concern, we reckon that palm oil would be a beneficiary as food companies switch to a cheaper vegetable oil. On average, CPO is 17% - 19% cheaper than soybean oil.
Wilmar and Indofood are the most aggressive in their landbanking policies. Both companies acquired other players to grow their landbank. We believe that Wilmar’s upstream expansion is part of its broader strategy to build up a global integrated business model. In the longer-term, we believe that this business model is more sustainable as earnings are smoother and less vulnerable to the volatilities of the commodities price cycle. Although IOI has not been as aggressive as Wilmar and Indofood in the upstream segment, the group has been slowly building up its presence in the food-based industries in USA and Europe through Loders Croklaan. Recently, IOI announced plans to construct new plants in USA and Europe, costing about US$200m in total.
Among the four companies, IOI was the most aggressive in capital management. Over the past years, the group has increased dividend payments and carried out a capital repayment, share split, share buy-backs and cancellation of shares. Going forward, however we believe that there is less room for capital management as the group conserves cash for expansion plans. We reckon that Sime Darby has the most attractive dividend policy as the group returns its cash back, mainly for the benefit of its largest shareholder, Permodalan Nasional Bhd.
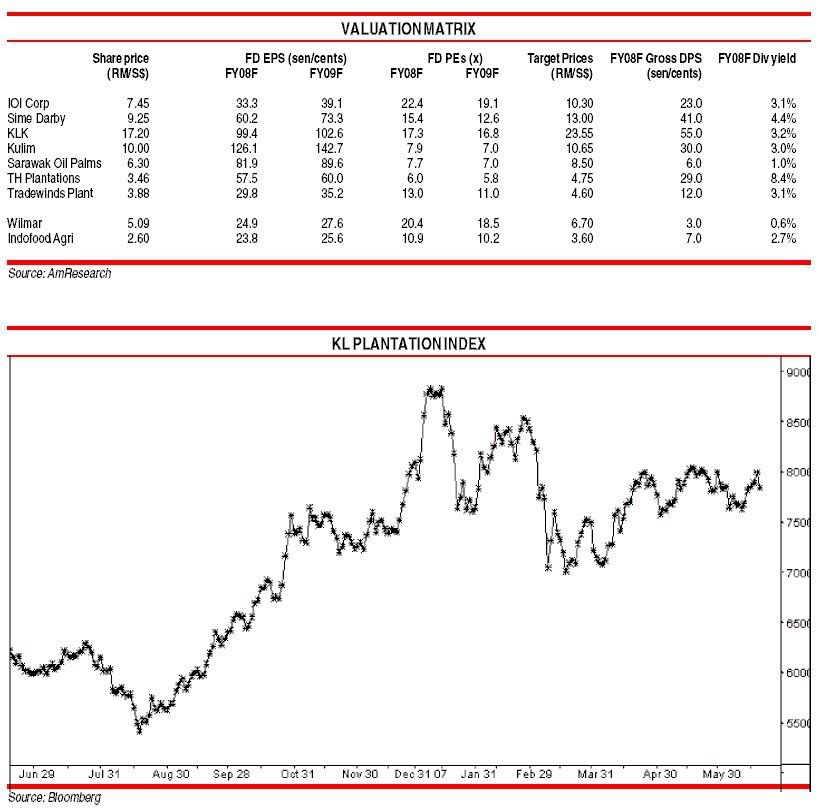
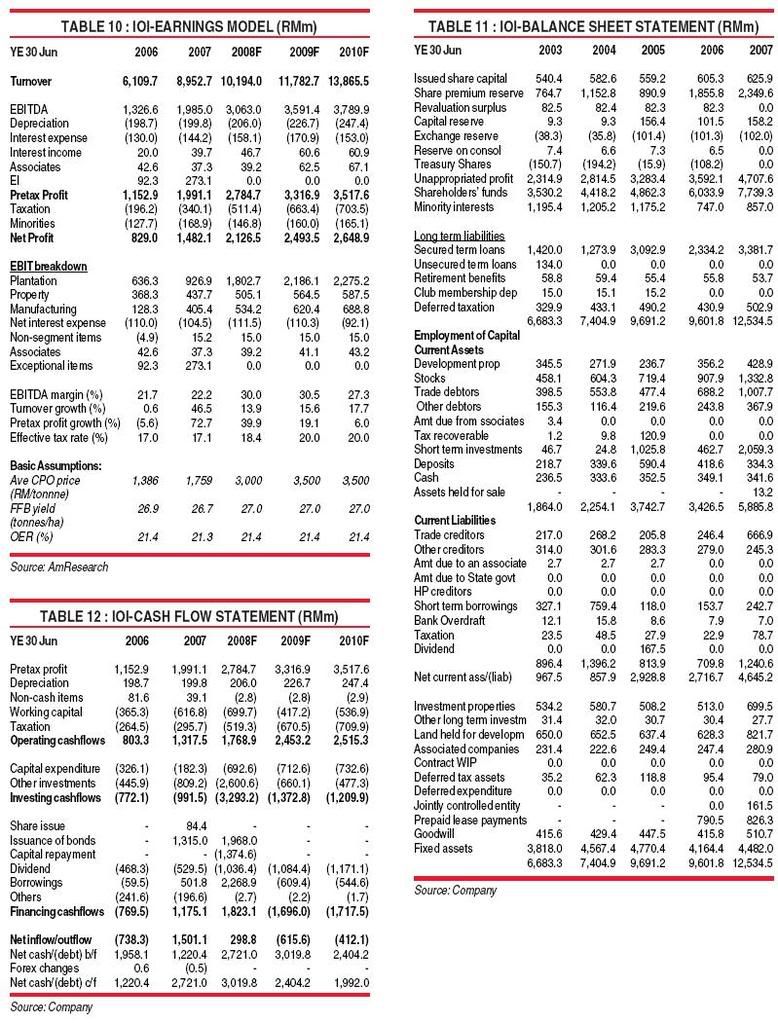
Valuation-wise, IOI is trading at FY09F PE of 19.1x, which is mid-way between its seven-year PE band of 7x to 27x. Wilmar’s FY09F PE of 18.5x is close to IOI’s valuation. Sime Darby and Indofood are trading at lower FY09F PEs of 12.3x and 10.2x respectively. As can be seen from the valuations and the companies’ strategy, there is a premium attached to IOI’s and Wilmar’s global exposure and integrated business model. We believe that this premium is justified as being integrated allows the plantation companies to be more efficient i.e. they can derive cost savings from almost every segment of the plantation value chain. Hence, we maintain Buy on IOI and Wilmar despite their higher PE valuations. We also like Sime Darby and Indofood for other reasons. We reckon that coming from a low base, Sime has the most potential to improve. Similarly for Indofood. As PP London Sumatra is not as efficient as Indofood, we believe that there is room for growth if Indofood is able to reduce LonSum’s costs and reap cost savings from the acquisition.


COMPARISONS BETWEEN THE BIG FOUR

In this report, we make comparisons between the four major plantation companies under our coverage, i.e. IOI Corporation, Sime Darby, Wilmar International Ltd and Indofood Agri-Resources.
We think that it would be interesting to compare the operations of these companies as collectively, they account for 15% of the world’s CPO output.
We divide the report into the following sections: -
1. Comparisons on upstream activities including analysis of hedging policies and age profile of oil palm trees;
2. Comparisons on downstream activities like refining and specialty fats;
3. Comparisons on corporate strategy;
4. Comparisons on capital management policy;
5. Comparisons on return on equity;
6. Comparisons on market reach or exposure; and
7. Comparisons on how integrated each company is.
In summary, we conclude the following:-
1. IOI’s competitive strength lies in the upstream palm oil business. The group is the undisputed leader as its operating costs are among the lowest in the region and its FFB yields, the highest.
2. Wilmar is the strongest among the four companies in the downstream segment of refining. The group’s refining margin is higher than IOI due to its large economies of scale and superb reading of the commodity markets.
3. Wilmar is also the most global player among the four companies. Wilmar’s market exposure is wide, reaching almost every continent on earth except for North and South America. In addition, Wilmar has the largest exposure to China, which is one of the fastest growing economies in the world.
4. Sime Darby is expected to have the most attractive dividend payouts among the four companies. The group’s historical payout policy has never been less than 40% of net profit and going forward, we expect this to increase to 50% for the benefit of its largest shareholder, Permodalan Nasional Bhd.
5. However, overall, IOI is the most active in capital management. Over the past few years, IOI has increased its dividends, carried out a capital repayment and share split and bought back and cancelled its shares.
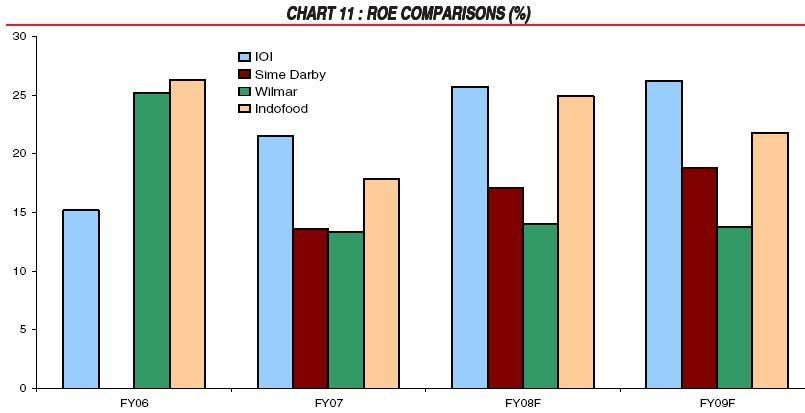
6. Among the four companies, IOI is the most efficient in using its capital. The group’s return on equity is the highest, at 21.5% for FY07 and 25.7% estimated for FY08F. A close second is Indofood Agri-Resources, which is seeing a surge in profitability due to the acquisition of PP London Sumatra (“LonSum”).

DIFFERENT COMPANIES, DIFFERENT REASONS TO BUY
Our conclusions reinforce our Buy recommendations on each of the plantation companies.
We like IOI for its efficient upstream plantation business and exposure to the developed markets of USA and Europe in the specialty fats segment.
Our Buy on Wilmar is premised on its global exposure to the developing markets of China, India and Russia. Wilmar also has large economies of scale, which improves cost efficiencies.
We also recommend to Buy Sime Darby as it has the highest upside potential among the four companies. As Sime’s operating costs/tonne are inefficient, we believe that there is potential for operating costs to come down if the group manages to extract cost savings and synergistic benefits from the acquisitions of companies like Golden Hope Plantations Bhd and Kumpulan Guthrie Bhd.
Indofood Agri-Resources is a Buy for its margin-enhancing acquisition of LonSum and dominant market share in the cooking oil business in Indonesia.

SHORT UPDATE ON CPO PRICES: CPO PRICE ASSUMPTION OF RM3,500/TONNE MAINTAINED
Our positive views on CPO prices remain intact for this year. As such, we maintain our CPO price assumption of RM3,500/tonne for 2008. Based on MPOB statistics, average monthly CPO price from January to May was RM3,502/tonne. As at 17 June, 3-month futures price was RM3,645/tonne.
Looking forward to 2009, it is difficult to predict the direction of CPO prices. Although previous USDA forecasts point to expanding soybean production in 2008/09, it is likely that these figures would have to be revised following the effects of the Midwest floods. Hence, for now we are leaving our 2009 CPO price assumption of RM3,500/tonne unchanged pending more clarity on the supply/demand numbers for next year.


USDA will be releasing a follow-up report in July or August after the release of its crop acreage report on 30 June. As the crop acreage report is only based on conditions and surveys taken in the first two weeks of June, the follow-up report will be released to take into account damages from the Midwest floods.
University researchers quoted in a Chicago Board of Trade report, estimated agricultural losses in Iowa at US$2.7bn. Out of the US$2.7bn, about US$2.6bn represented losses of grain crops like corn or soybeans. The researchers added that about 15% to 20% of acreage were completely damaged due to the floods. According to USDA, Iowa was expected to plant 13.2m acres of corn and 9.8m acres of soybean this season.
Corn has an impact on CPO prices as the shortage of corn would increase demand for soybean. Higher soybean prices translate into rising CPO prices.

COMPARISONS ON UPSTREAM ACTIVITIES
In the upstream segment, we compare the four plantation companies in terms of their hedging policies, age profile of the trees, operating costs, exposure to Indonesia, landbank expansion policy and Roundtable on Sustainable Palm Oil (“RSPO”) plantings.
1. Hedging policies
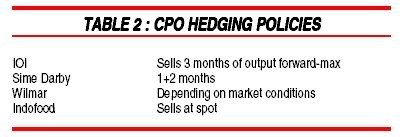
IOI’s current policy is to sell three months forward while Wilmar’s policy varies depending on the current trend of CPO prices (please refer to Table 2).
Indofood’s policy is to sell at spot prices. Its subsidiary, LonSum used to sell forward but stopped recently due to difficulties in calculating the export tax. The export tax in Indonesia is based on CPO prices in the month of delivery.
Sime Darby’s hedging policy is 1+2 months i.e. the group sells all of the CPO output in the first month of production at spot prices. In the second month, Sime would sell forward 80% of the CPO production while in the third month, the group would sell forward 50% of the output.
We understand from management that under this policy, essentially most of the group’s CPO output are sold at spot prices.
Among the four companies, we find that Wilmar reads the CPO market, the best. Although the group does not disclose the CPO prices on which it sold forward, from the group’s selling policies revealed during conference calls and discussions with management, we find that Wilmar is quite astute in reading the market. For instance, in late-2007, the group accumulated inventory and held back sales of CPO as it believed that CPO prices would reach as high as RM3,500/tonne.
Subsequently, early this year, CPO prices penetrated the RM4,000/tonne level and the group disclosed in its conference call in February, that it was cautious on CPO prices. Wilmar also said at that time that it had sold forward more than one-half of its FY08F CPO production. After that, CPO prices retraced to a low of RM3,056/tonne in April before rebounding back to its current levels of RM3,500/tonne to RM3,700/tonne.
At the conference call in May, Wilmar sounded more optimistic on CPO prices compared to the start of the year. The group believes that escalating crude oil prices and European Union’s and American biofuel policies would continue to support CPO prices.

2. Age profile of oil palm trees
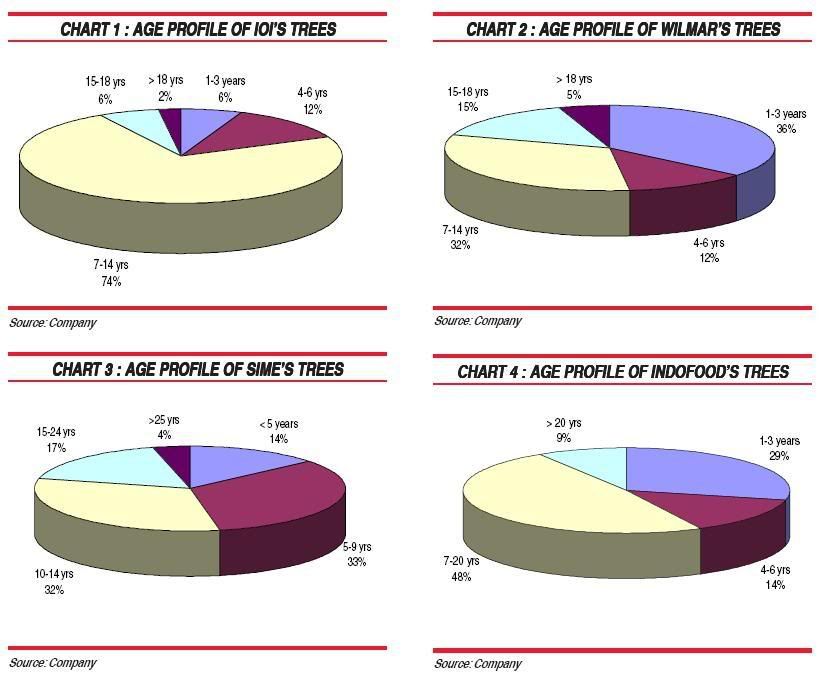
In the short-term, the age profile of IOI’s oil palm trees is the most attractive among the four plantation companies. About 74% of the group’s trees were in the prime stage of seven to 14 years as at end-June 2007 (please refer to Chart 1). This coupled with good estate management practices are reflected in the group’s sterling FFB yields of 26 tonnes/ha to 28 tonnes/ha in the past three years.
The company with the second most attractive age profile is Indofood. Approximately 48% of the group’s trees (including LonSum) are between seven to 20 years (please refer to Chart 4). Like IOI, Indofood’s FFB yields were also impressive in the past. However, going forward, we do not see exponential growth in group FFB yields as LonSum is not as efficient as Indofood.


In the longer-term however, a higher proportion of trees in the young years bode well for plantation companies as these trees would enter the prime stages, replacing the prime trees, which would then be ageing.
In this respect, we see Wilmar as having the most attractive age profile as approximately 36% of its trees were between one to three years as at end-December 2007 (please refer to Chart 2).
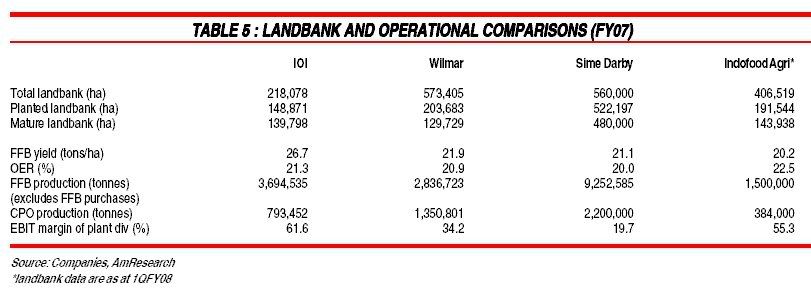
About 63% of Wilmar’s 573,405 ha of landbank were still unplanted as at 1QFY08 and the group’s target is to develop 35,000 ha - 40,000 ha of landbank every year (please refer to Table 4).
We believe that in three to five years’ time, Wilmar should start to enjoy incremental growth in FFB production as more trees enter the prime ages of seven to 14 years.
As for IOI, its Indonesian landbank of 52,704 ha (24% of total landbank) should alleviate the problem of not having any young trees. The group plans to develop about 15,000 ha of landbank every year (please refer to Table 4). New plantings are expected to start in FY09F and contribution should start coming in FY12F.
Among the four plantation companies, Sime Darby has the most balanced age profile of oil palm trees. Approximately 14% of its trees are below five years old while 33% and 32% of the trees are in the age bracket of five to nine years and 10-14 years respectively (please refer to Chart 3).
Interestingly, new plantings have been below expectations this year due to various reasons. For instance, Wilmar’s new plantings slowed due to implementation of the Roundtable Sustainable Palm Oil (“RSPO”) guidelines while Indofood planted less because of heavy rainfall. Nevertheless, we expect plantation development expenditure to recover in the following year as each plantation company strives to improve the age profile of its trees and increase future CPO production.
3. Operating costs
Thanks to economies of scale from the group’s high FFB yields and well-managed oil palm estates, IOI’s operating costs are consistently among the lowest in the industry (please refer to Table 3).


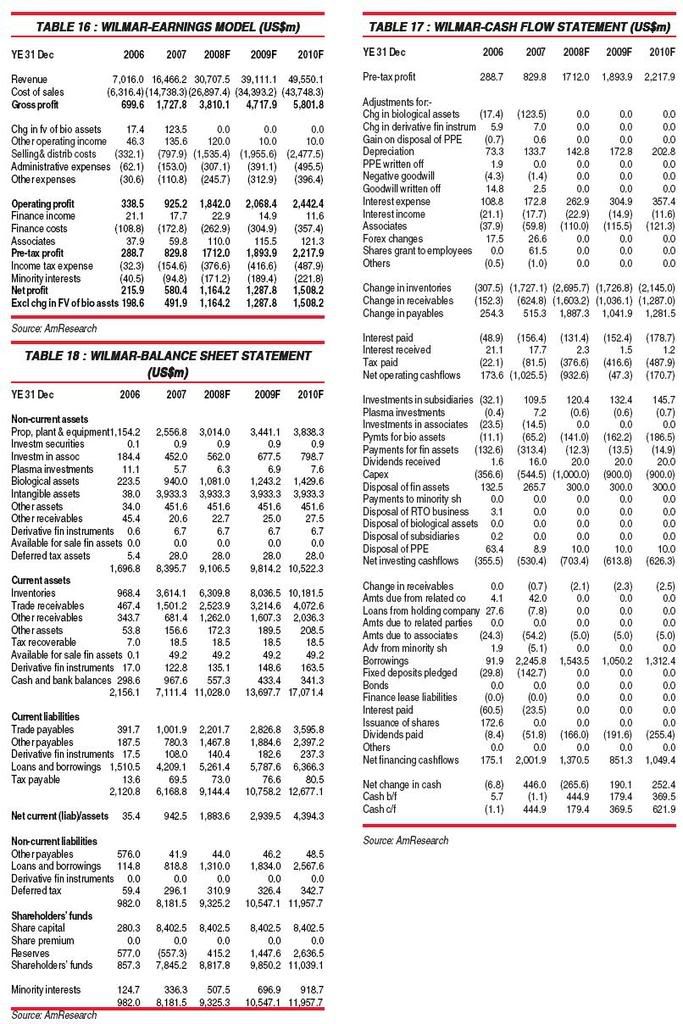
Among the four plantation companies, IOI’s operating costs was US$256/tonne in FY07 versus Indofood’s US$283/tonne, Wilmar’s US$332/tonne and Sime Darby’s US$304/tonne. Wilmar’s operating costs are high compared to IOI and Indofood because of its young trees.
Going forward, although operating costs are expected to rise due to fertiliser and transport costs, on a per tonne basis we believe that IOI would retain its status as a lowcost producer. A contributing factor to IOI’s efficiency is management’s hands-on approach. Tan Sri Lee Shin Cheng is known to personally visit and inspect some of the group’s oil palm estates in Malaysia.
We expect Indofood’s operating costs/tonne to rise this year as LonSum is not as efficient as Indofood. To reduce LonSum’s operating costs, Indofood has proposed measures like using in-house vehicles to transport FFB to mills instead of relying on external contractors.
Indofood would also increase the size of LonSum’s plantation estates as currently, the high-cost Plasma estates owned by the smallholders are a substantial 19% of total planted landbank. Indofood would also try to bring down overhead costs like headquarters and corporate expenses.
As mentioned earlier, Sime Darby has the greatest potential among the four plantation companies to reduce cost inefficiencies. Sime Darby’s planted landbank of 522,197 ha are large enough to generate the kind of economies of scale needed to decrease operating costs/tonne. To do this, Sime plans to increase its FFB yields and oil extraction rates. Also, nonessential operating costs like overhead would be lowered.
Going forward, as mentioned earlier, we expect operating costs for the plantation sector to rise on the back of higher fertiliser and transportation costs. Fertiliser costs have gone up by 70%-80% since last year due to escalating crude oil prices.
As such, if plantation companies did not lock-in their fertiliser costs late last year or early this year, they would be experiencing significantly higher costs. We understand that the increase in fertiliser costs would cause operating costs to be higher by RM100/tonne to RM150/tonne.
For IOI, the group would be locking-in its fertiliser supply for FY09F either this month or next. For FY09F, fertiliser costs are expected to range between RM1,600/ha to RM1,800/ ha while for FY08F, fertiliser costs were between RM1,100/ ha to RM1,200/ha. In FY07, fertiliser costs were a mere RM1,000/ha. Fertiliser accounts for almost 50% of total production costs now compared to only 30% a few years back.

4. Exposure to Indonesia
In this report, we also make comparisons in respect of each company’s exposure to Indonesia as the latter is now the largest producer of palm oil in the world. Indonesia is also the biggest exporter of palm oil to India.
Although cost-wise, Indonesia is nearly the same as Malaysia or in some cases, even higher because of hidden expenses and poorer infrastructure, Indonesia is still an attractive country for palm oil cultivation. This is because of its volcanic soil and better fruit pollination, which gives higher oil extraction rates.
Also, there is an abundance of land in Indonesia compared to scarcity in Malaysia. Additionally, Indonesia is a more familiar and proven planting ground compared to the likes of Papua New Guinea as there are quite a few Malaysian plantation companies, which are doing well in Indonesia. These include Kuala Lumpur Kepong Bhd (“KLK”) and PPB Oil Palms, which is now under Wilmar. Indonesia accounts for almost one-third of KLK’s plantation turnover.
Among the companies under our coverage, Indofood has the largest exposure to Indonesia. All of the group’s landbank or approximately 406,519 ha are located in Indonesia (please refer to Table 5). A close second is Wilmar, which has approximately 493,393 ha or 86% of its landbank located in Indonesia. Due to the acquisition of PPB Oil Palms in 2006, Wilmar also has about 80,014 ha of landbank in East Malaysia.
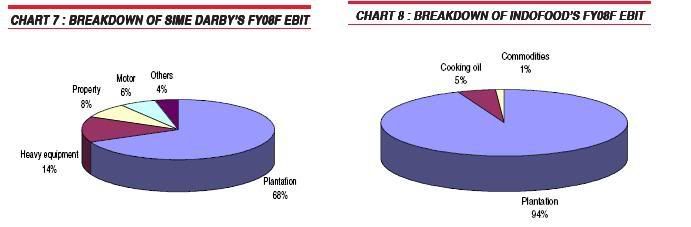
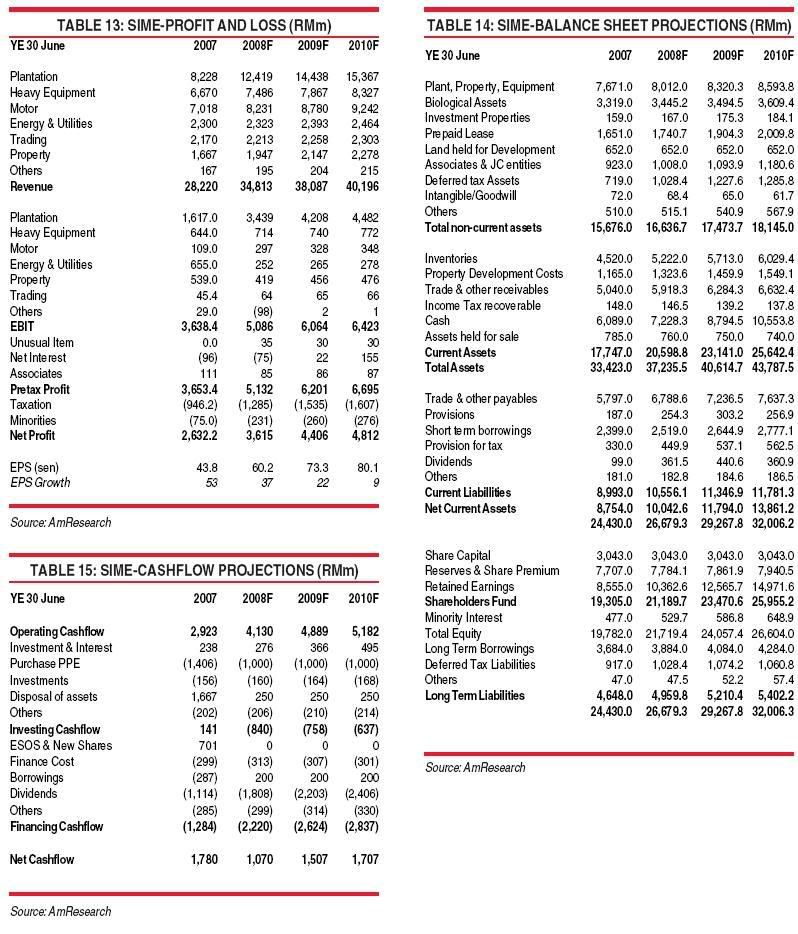
Approximately 36% or about 195,156 ha of Sime Darby’s landbank are in Indonesia while IOI, which is the new kid on the block in Indonesia, has about 52,704 ha. In terms of earnings, we reckon that Indonesia accounts for roughly 30% of Sime Darby’s plantation EBIT. Indonesia would only start contributing to IOI’s earnings from FY12F onwards.


5. Landbank expansion policy
Among the four plantation companies, we find that Wilmar and Indofood’s landbank expansion policies are the most aggressive. Both companies expanded the size of their plantation landbank by acquisitions. Interestingly, the timing of the acquisitions were good as they took place before CPO prices surged past the RM3,000/tonne level.
Although Sime Darby is also the result of mergers and acquisitions of a few Malaysian plantation companies, the intention of the consolidation was to create a mega size plantation company and not because each of the acquired plantation company wanted to merge.
IOI is the most conservative among the four plantation companies in its landbank expansion policy. The group finally ventured into Indonesia last year. This is after saying many times that it would not because of the country’s political risk.
Also, IOI acquired a small 9,040 ha of landbank in Sarawak last year as a platform for the group to expand further in the state. However, the group recently rescinded the proposed acquisition of 44,350 ha of land in Sarawak from a few private companies due to non-completion of certain terms and conditions.
Going forward, we believe that the cost of landbank acquisition would continue to rise. Among the four plantation companies, we reckon that IOI would be the one continuing to expand its landbank. The landbank size of the other three plantation companies are huge enough to keep the respective companies busy for the next five to ten years. As an indication of land prices, IOI’s acquisition of its Indonesian landbank last year was at US$421/ha. Currently, we understand that the market price for greenfield landbank in the country is about US$600/ha or 43% higher than IOI’s acquisition price.

6. RSPO plantings
Amongst others, RSPO guidelines ensure that palm oil cultivation are environmentally friendly. The RSPO guidelines are based on eight principles, which include commitment to transparency, environmental responsibility, conservation of natural resources and biodiversity and responsible development of new plantings (please refer to Table 6).
The guidelines are increasingly important in light of protests and complaints from the environmental organisations in Europe. The complaints are mainly in respect of the destruction of animal habitats and use of fires to clear up forests for palm oil cultivation.
Other motivation factors to comply with RSPO guidelines include the fact that some customers e.g. Unilever would only buy certified palm oil-based products. Unilever said it would start buying certified palm oil by 2015. The silver lining is that RSPO-certified palm oil could command premium pricing as high as 10%. The higher selling price would help offset higher costs resulting from the compliance and certification of RSPO.
RSPO guidelines include implementation of a proper water management system and a ban on use of fire on peat soil (please refer to Table 5). Some of the guidelines such as non-usage of fire to open up plantation areas are already practised by plantation companies in Malaysia and Indonesia.
Presently, two bodies are allowed to provide RSPO certification. These are SGS Malaysia and Control Union. Another company, Sirim QAS is still waiting for approval from the RSPO Executive Board. The four plantation companies are currently following RSPO guidelines for their new plantings. These include IOI’s, Wilmar’s and Indofood’s new plantings in Indonesia. Some of Wilmar’s plantings in East Malaysia would also be following RSPO guidelines.


(table 6)
----------------------------------------
Criteria
Efficiency of energy use and use of renewable energy is maximised

Indicators
Monitoring of renewable energy use per tonne of CPO or palm product in the mill.
Monitoring of direct fossil fuel use per tonne of CPO of FFB where grower has no mill.

Guidance
Growers and mills should assess the direct energy use of their operations, including fuel and electricity and energy efficiency of their operations. This should include estimation of fuel use by contractors including all transport and machinery operations.
The feasibility of collecting and using biogas should be studied if possible.
----------------------------------------
Criteria
No new plantings are established on local people’s land without their consent, dealt with through a documented system that enables indigenous people and local communities to express their views through their own representative institutions

Guidance
Where new plantings are considered to be acceptable, management plans and operations should maintain sacred sites. Agreements with indigenous people and local communities should be made without coercion or undue influence.
----------------------------------------
Criteria
Use of fire in the preparation of new plantings is avoided other than in specific situations as identified in ASEAN guidelines or other regional best practice.

Indicators
No evidence of land preparation by burning
Documented assessment where fire has been used for preparing land for planting Evidence of approval of controlled burning as specified in ASEAN guidelines or best practice.

Guidance
Fire should be used only where an assessment has demonstated that it is the most effective and least environmentally damaging option for minimising the risk of severe pest and disease outbreaks and with evidence that fire-use is carefully controlled
----------------------------------------
(end of table 6)


Among the four companies, Wilmar was the only one that faced complaints in respect of its plantation activities in Indonesia. We believe that this could be due to the group’s large presence in Indonesia, which invites heavy scrutiny from the NGOs.
Some of the complaints against Wilmar related to the local communities’ rights on land clearing, poor quality of Wilmar’s Environmental Impact Assessment (“EIA”) reports, conversion of forests without conducting High Conservation Value Forest (“HCVF”) assessments and open fire burning.
In response to these complaints, Wilmar has said that it would observe all legal and statutory requirements for land development and pay special attention to the potential presence of HCVF in the future.
In addition, the group would adopt a precautionary approach by conducting EIAs and a full HCVF Assessment and Social Impact Assessment before commencing any land development in the future. As for open fire burning, Wilmar said that it enforces a strict zero burning policy in all of its plantation operations.

COMPARISONS ON DOWNSTREAM ACTIVITIES
In summary, we find that Wilmar is the leader in the refining segment of the downstream business. In our view, IOI is best in the oleochemicals and specialty fats sub-segments.
Although Wilmar is larger than IOI in the specialty fats segment, we prefer IOI as we see good growth in USA and Europe. In addition, we believe that pricing in the American and European markets would be more stable and less competitive than the Chinese market.
1. Refining segment
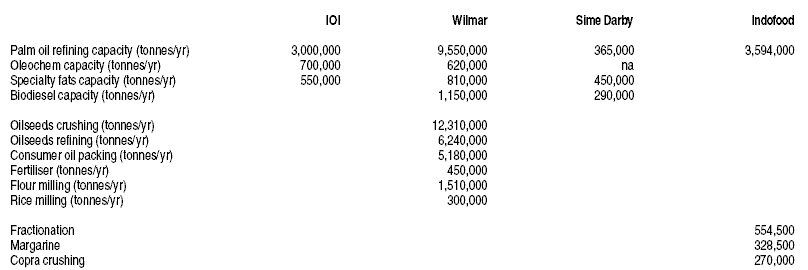
Wilmar is the undisputed leader in the refining business. With 9.6m tonnes of palm oil refining capacity in Indonesia and Malaysia and 18.7m tonnes of oilseeds crushing and refining capacity in China (please refer to Table 7), the group is the largest vegetable oil processor in Asia.
Wilmar’s strength not only lies in the large economies of scale, which helps maintain costs at an efficient level but also in the group’s knowledge of the commodity markets. This is because Wilmar is directly involved in two of the largest vegetable oil products in the world i.e. palm oil and soybean. Wilmar buys soybean from Brazil for crushing in China.

TABLE 7 : DOWNSTREAM MANUFACTURING CAPACITIES


In addition, as one of Wilmar’s major shareholders, USbased Archer Daniels Midlands Ltd is one of the largest vegetable oil producer in the world, Wilmar has the advantage of securing market intelligence from Archer Daniels on the direction of vegetable oil prices in USA and Europe. All these give Wilmar, an edge in reading the commodity markets and timing its purchases of vegetable oils well.
In recent times when CPO and soybean prices have been rising, Wilmar’s refining margins have expanded due to improving demand and well-timed purchases of feedstock. Even when vegetable oil prices were in the doldrums before 2H2005, Wilmar was still in the black in contrast to some refiners in Malaysia, who were bleeding.
Among the four plantation companies, Wilmar’s competitors are Indofood and IOI. Indofood has 3.6m tonnes of refining capacity while IOI’s refining capacity is about 3m tonnes. However, as the bulk of Indofood’s refined palm oil are used internally to manufacture cooking oil in Indonesia, we consider IOI to be a closer competitor to Wilmar.
Between IOI and Wilmar, Wilmar’s palm oil refining margin is higher. Although pre-tax and EBIT margins are not directly comparable, they give an idea on how efficient each company is.
In 1QFY08, the pre-tax margin of Wilmar’s merchandising and processing division (mainly palm oil refining) was US$27/tonne or 78% YoY higher. In comparison, we understand that the EBIT margins of IOI’s refining division are US$20/tonne in Malaysia and Euro20/tonne in Rotterdam.
However, in terms of improvement, IOI’s refining margin showed a larger expansion compared to Wilmar. EBIT margin of IOI’s refining division in Malaysia jumped from a mere US$5/tonne a year ago to US$20/tonne currently. In Rotterdam, IOI’s refining margin remained stagnant at Euro20/tonne.
For the Malaysian refining industry as a whole, palm oil refining margin has been improving not only because of rising demand but also due to consolidation in the industry. Since Wilmar acquired the refining assets of PPB Group in 2007, competition has declined and this has helped to improve refining margin.
Apart from palm oil refining, Wilmar also crushes and refines soybean in China as mentioned earlier. The pre-tax margin of the oilseeds and grains division was US$40/ tonne (ex-forex gains) in 1QFY08 compared to US$4/ tonne in 1QFY07.
Going forward, we expect refining margin to be positive, although growing at a slower rate, underpinned by expanding demand. We believe that Wilmar would continue to be the leader in the refining segment on the back of its size and market knowledge.

2. Cooking oil
Comparisons are made between Indofood and Wilmar as only these two companies manufacture cooking oil. Although Sime Darby also has a cooking oil division, it is too small for comparison’s sake. Sime Darby’s cooking oil products in Malaysia are Golden Joma and Delico.
In general, the cooking oil business is expected to face challenging times due to rising vegetable oil prices. In Indonesia, Indofood has not faced any problems raising selling prices yet while in China, margins are expected to decline as companies have to seek approval from authorities to increase selling prices.
Indofood is one of the largest cooking oil manufacturers in Indonesia. The group has different cooking oil products for different market segments. Indofood’s market share in the Indonesian branded cooking oil industry was 42% in 2007. Wilmar’s market share was about 19.5% in the same segment. Wilmar has the second largest market share in the cooking oil industry in Indonesia after Indofood.


Some of Indofood’s cooking oil products include Bimoli Spesial for the high-end market, Bimoli for the middleincome consumers and Delima for the low-end market.
Wilmar’s cooking oil products in Indonesia are Sania and Fortune, targeted at the middle-income to high-end market. Indofood’s large market share and economies of scale in the cooking oil industry in Indonesia allows it to be the leader in pricing. The ability to increase selling prices is important in the wake of rising CPO costs.
In 1QFY08, Indofood raised the average selling price of its cooking oil products in Indonesia by 57% YoY. Surprisingly, demand did not weaken as sales volume rose 20% YoY. Due to the higher selling prices, operating profit margin of Indofood’s cooking oil division expanded from 1.5% in 1QFY07 and 1.9% in 4QFY07 to 5% in 1QFY08.
Some of Indofood’s cooking oil products include Bimoli Spesial for the high-end market, Bimoli for the middleincome consumers and Delima for the low-end market.
Wilmar’s cooking oil products in Indonesia are Sania and Fortune, targeted at the middle-income to high-end market. Indofood’s large market share and economies of scale in the cooking oil industry in Indonesia allows it to be the leader in pricing. The ability to increase selling prices is important in the wake of rising CPO costs.
In 1QFY08, Indofood raised the average selling price of its cooking oil products in Indonesia by 57% YoY. Surprisingly, demand did not weaken as sales volume rose 20% YoY. Due to the higher selling prices, operating profit margin of Indofood’s cooking oil division expanded from 1.5% in 1QFY07 and 1.9% in 4QFY07 to 5% in 1QFY08.
Furthermore, we understand that consumers have not shifted from branded to non-branded cooking oil products. In May, Indofood raised the selling prices of its products by another 3% to 10% (from April’s selling prices).
Although Wilmar is not as dominant as Indofood in the cooking oil business in Indonesia, Wilmar is big in China. The group’s market share is between 43%-50% in the consumer packs segment in China. In addition, Wilmar’s Arawana cooking oil is the official cooking oil in the coming Beijing Olympics. The group’s cooking oil is mainly made from soybean.
Wilmar’s competitive advantage lies in its wide distribution and marketing network in China. The acquisition of PPB Group’s assets have been complementary and synergistic as they allow the enlarged group to have a presence in both the inland and coastal cities.
Interestingly, Indonesia is a more liberal country compared to China in the cooking oil business. In Indonesia, there are no ceiling prices on cooking oil products and producers do not need to seek approval from authorities to increase selling prices of the branded products. In contrast, in China to curb inflation, authorities have to approve any increase in selling prices of food products.
Due to this, margins of the cooking oil business in China are not expected to be as lucrative as Indonesia. In 1QFY08, pre-tax margin of Wilmar’s consumer products division fell from US$20/tonne in 1QFY07 and US$65/ tonne in 4QFY07 to US$18/tonne.
A silver lining is that Wilmar has already received approval from the Chinese authorities for a 10% price increase. However, the group has not implemented the price increase yet as they would like to keep it for future use in case vegetable oil prices start to surge irrationally again.
For FY08F, we forecast the pre-tax margin of Wilmar’s consumer products division to fall from US$59/tonne in FY07 to US$20/tonne in FY08F. We have also imputed a 10% increase in average selling price of the division.


3. Oleochemicals
We believe that IOI is better than the other three companies in the field of oleochemicals. Although Wilmar has exposure to the oleochemical market in China, we prefer IOI as the group’s higher-margin customer base in USA, Japan and Europe means that the customers are more quality conscious and less likely to switch to other products just because of price increases.
Like cooking oil, the oleochemical industry is envisaged to face tough times due to high feedstock costs. Prices of raw materials like refined palm stearin and palm kernel oil (“PKO”) are forecast to rise in line with the uptrend in CPO prices. Apart from this, expanding oleochemical production capacity in the region have also resulted in an increase in demand for the raw materials, pushing up prices of PKO and refined palm stearin.
Although selling prices of oleochemicals are expected to go up due to high crude oil prices, this would not be enough to compensate for rising feedstock costs.
IOI exports mainly to USA and Europe. In addition, IOI also has long-term contracts with Kao Corporation of Japan. IOI’s preferred customer base are the pharmaceutical companies as their demand would remain resilient despite an increase in selling prices.
Furthermore, barriers to entry into the pharmaceutical industry are high. It is not easy for new oleochemical companies to supply to pharmaceutical companies as they would need to have a proven and established track record first.
IOI’s competitive advantage also lies in the fact that its machineries can use both PKO and refined palm stearin as feedstock to produce fatty acids. This is useful as the group can switch to PKO when prices of refined palm stearin surge and vice versa. In contrast, oleochemical companies, which have been using refined palm stearin as feedstock only, would not be able to switch to PKO.
Due to IOI’s competitive advantages, it is not surprising that despite the rising cost of raw materials, the group can still sustain its margins. We understand that EBIT margin of the oleochemical division is currently RM400/tonne, which is the same as last year.

4. Specialty fats
We prefer IOI to Wilmar in this segment of the plantation value chain. After the completion of the group’s plants in USA and Malaysia, IOI would surpass Wilmar in terms of production capacity in the future.
In contrast to Wilmar’s exposure to China, IOI’s exposure is to the developed markets of USA and Europe. Although these countries are perceived as mature and stable markets, we believe that there are good growth opportunities in the specialty fats segment. We prefer the US and European markets to China for a few reasons.
First, the Chinese market is very competitive and producers compete on pricing. In comparison, the market for palm oilbased products in USA and Europe is based on palm oil’s positive health benefits. Hence, demand for palm oilbased specialty fat products is expected to be more resilient and less vulnerable to pricing.
Due to health risks associated with trans-fats, more cities in USA e.g. New York are banning the use of trans-fats in restaurants. Increasingly, food companies like Kraft are using palm oil-based products to manufacture biscuits and cookies.
Second, there are not many palm oil-based specialty fats companies in USA. Among the companies under our coverage, IOI is the only one. We reckon that IOI’s Loders Croklaan is well-placed to enjoy increasing demand for palm oil-based specialty fats products in USA.
As a reflection of improved demand and pricing, EBIT margin of IOI’s specialty fats division expanded from Euro15/tonne last year to Euro20/tonne currently. The positive outlook for palm oil in USA is also reflected in the 54% YoY surge in Malaysian palm oil exports in the first five months of the year and IOI’s expansion of its specialty-fats operations in the country.


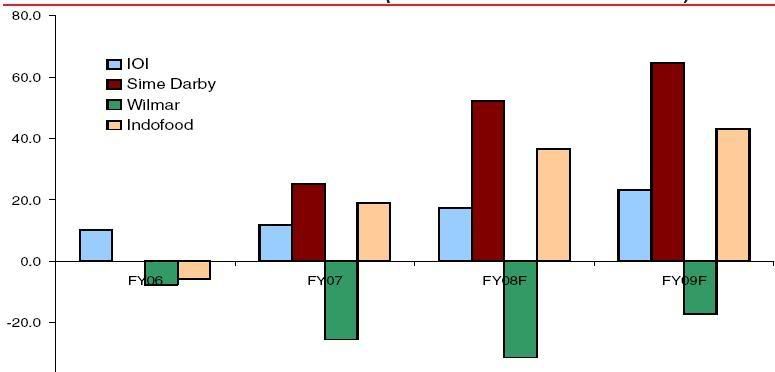
CHART 9 : FCF/SHARE COMPARISONS (REPORTING CURRENCIES-SEN/CENTS/RPH)


COMPARISONS ON CORPORATE STRATEGY
We find that Wilmar is the most aggressive compared to the other three companies in pursuing its ambition towards becoming a global agribusiness company. The group also moves fast in executing its strategy.
By acquiring the agribusiness assets of its shareholders and PPB Group in 2006/07, Wilmar transformed not only into one of the largest vegetable oil processors in the region but also one of the biggest upstream players. Wilmar continued with its expansion plans by increasing the production capacity of its crushing and refining plants in the region and venturing into Africa and Russia.
IOI appears to be faster in executing its downstream strategy compared to upstream. In the oleochemical and specialty fats segments, the group acquired Pan Century Group last year and announced plans to build plants in US and Rotterdam this year.
However, in the upstream segment, we find that IOI is more conservative compared to the other plantation companies. The group was one of the slowest to venture into Indonesia to expand its plantation landbank.
Indofood also acted fast in the upstream segment by acquiring LonSum. This increased the group’s landbank by 40%-45%. The acquisition of LonSum ensures reliable supplies of CPO for Indofood’s cooking oil division and enhances the enlarged group’s operating margins as there is a greater proportion of upstream earnings compared to the single-digit margins that the cooking oil division currently commands.
Although Indofood is the largest cooking oil manufacturer in Indonesia, we reckon that the group is not a significant player in the downstream segment of the plantation business compared to Wilmar or IOI. It appears that Indofood prefers to concentrate on the upstream segment for now e.g. improving LonSum’s inefficient operations, reaping cost savings from the merger of assets between the two entities and venturing into sugar cane plantations.
Sime Darby is more of a conglomerate instead of an agribusiness player as it has quite a few non-plantation businesses. In the plantation segment, the group’s strategy is to reap cost-savings from its acquired companies while in the downstream segment, the group is looking to Africa and Europe for opportunities. Sime also recently announced that it would be venturing into rice production in Sarawak.

COMPARISONS ON CAPITAL MANAGEMENT POLICIES
Among the four companies, we reckon that Sime Darby would provide investors with the most attractive dividend yield. Dividend yields of the other three plantation companies are not expected to be exciting as cash is being conserved for expansion plans. Sime Darby’s FY08F dividend yield is forecast at 4% compared to IOI’s 3%, Wilmar’s 0.6% and Indofood’s 3%.


In terms of other capital management initiatives, then IOI is the most active. Since the past five years, IOI had undertaken a capital repayment exercise, a 5-into-1 share split and treasury shares cancellation.
We believe that Sime Darby has the most potential among the four companies to pay higher dividends due to the cash preference and requirements of its major shareholder, Permodalan Nasional Bhd (“PNB”). We understand that during the past five years (before the re-listing), Sime Darby’s dividend payouts had never been less than 40%.
Sime Darby’s dividend payouts are expected to be supported by rising free cash flows (“FCF”) underpinned by robust CPO prices. For FY08F, we forecast Sime’s FCF/ share at 52.1 sen versus Wilmar’s (-31.5) cents, IOI’s 11.8 sen and Indofood’s 36.6 Rph (please refer to Chart 9).
IOI is in an expansionary mode especially in the field of specialty fats. The group plans to construct a US$100m specialty fats plant in USA (200,000 tonnes/year) and a US$100m margarine plant in Rotterdam, Netherlands. In Malaysia, IOI plans to build a 150,000 tonnes/year specialty fats plant, which is expected to cost RM300m, in Pasir Gudang.
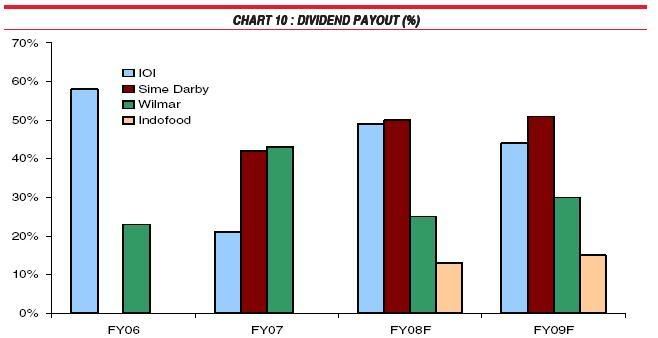
As such, we believe that IOI’s dividend payouts are not expected to be spectacular going forward. Dividend yields are forecast to range between 3% to 4% for FY08F-FY10F while dividend payout is estimated at 49% for FY08F and 44% for FY09F (please refer to Chart 10).
Unless IOI consolidates its shares back again, capital repayment is unlikely going forward as the par value of the group’s share is only 10 sen.
However, we reckon that IOI would continue to be active in buying back its shares. Since the start of the year, the group has been buying back its own shares at price levels as low as RM6.55/share.
After the amount of treasury shares reach a certain level, we believe that the group would cancel them to enhance EPS. In FY6/05, IOI cancelled 54m treasury shares and in FY6/07, the group cancelled 64m shares. As at 16 June, outstanding treasury shares amounted to 144.9m.
The same proposition goes for Wilmar and Indofood. Although Wilmar is already one of the largest agribusiness companies in the world, the group believes that it is still a growth company. The group is seeking to expand in Africa and Russia.
Wilmar’s capex is forecast at US$800m to US$1bn annually for the next few years. These would cover construction of new plants and expansion plans in Indonesia, China, Russia and Africa. We forecast Wilmar’s gross DPS at 3 cents for FY08F and 4 cents for FY09F, which translate into yields of less than 1% each (FY07: 2.6 cents).
As for Indofood, the group’s capex is in respect of plantation development expenditure and construction and relocation of refineries in Indonesia. The group’s capex is forecast at US$95m for FY08F, out of which about 53% are allocated for new plantings. Indofood’s planting programme is to cultivate 35,000 ha of land every year.
We forecast a FY08F gross DPS of 7 cents/share for Indofood, which implies a yield of 3% and payout of 13%.


COMPARISONS ON RETURN ON EQUITY(“ROE”)
1. Net profit margin
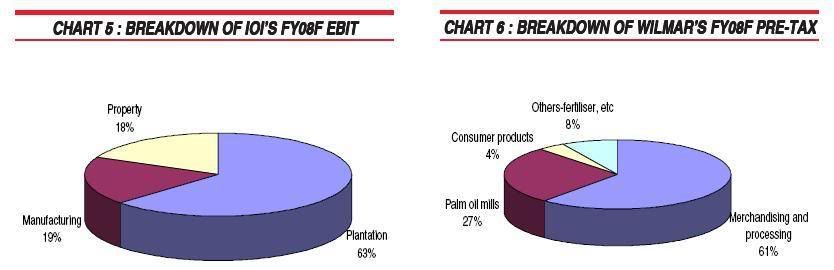
IOI’s net profit margin is 21% for FY08F versus Sime’s 10%, Wilmar’s 4% and Indofood’s 15%. Comparing IOI with Wilmar and Indofood, IOI’s higher net profit margin can be attributed to a larger proportion of upstream plantation earnings.
In comparison, Wilmar’s earnings are mainly from the single-digit margin refining and crushing businesses. Although Indofood’s EBIT margin is on par with IOI, its net profit margin is below IOI’s because of higher interest and tax expenses.
Although Sime’s earnings is mainly from the upstream plantation activities like IOI, its net profit margin is not as high as IOI due to cost inefficiencies. Sime’s FFB yield of 21.1 tonnes/ha for FY07 was lower than IOI’s 26.7 tonnes/ ha. Furthermore, Sime’s operating costs of RM960/tonne were also higher than IOI’s RM809/tonne in FY07.
Over the past two years, we find that IOI’s net profit margin improved the most between the four companies i.e. from 14% in FY06 to 21% for FY08F. Wilmar’s net profit margin inched up from 3% in FY06 to 4% in FY08F while Indofood’s remained flat at 15%. Sime’s net profit margin is also expected to be relatively stagnant at 10% in FY08F compared to FY07’s 9%.
2. Asset turnover
Asset turnover indicates how much sales are generated from the company’s assets.
We find that among the four companies, Wilmar generates the most sales out of its assets. Out of US$1.00 of asset, we forecast the group to generate revenue of US$1.52 in FY08F. This indicates that Wilmar is quite efficient in using its assets. Second in line is Sime Darby, with an asset turnover ratio of 0.9x. The asset turnover of IOI and Indofood are almost the same at 0.5x to 0.6x respectively.
We believe that factors contributing to Wilmar’s high asset turnover are the strength of its marketing and distribution network and integrated manufacturing process.

3. Leverage
Leverage indicates the proportion of debt to equity. Among the four companies, Indofood has the highest equity multiplier of 2.6x for FY08F. IOI’s and Wilmar’s leverage are almost the same at 2.3x each, estimated for FY08F. Sime’s is the lowest at an estimated 1.8x for FY08F.


Indofood’s leverage is high as the group borrowed US$180m to finance the acquisition of LonSum. However, recent quarterly results indicated that the earnings contribution from LonSum has been accretive, more than sufficient to offset the increase in interest expense.
Wilmar’s gearing is high because of the nature of its refining business. Working capital is needed to finance the feedstock needed for its palm oil and soybean crushing and refining activities and cooking oil manufacturing business. Out of Wilmar’s borrowings of US$5.0bn as at end-December 2007, about 84% were short-term borrowings. These consisted mainly of loans and discount bills.
IOI’s leverage is high because the group issued US$600m convertible bonds last year to finance its expansion plans and working capital. To recap, IOI plans to expand its specialty fats plants in Malaysia, US and Rotterdam.
Sime Darby has the lowest leverage as there are no concrete plans to build new manufacturing plants or acquire new plantation landbank yet. This is in spite of news reports back in March that the group plans to develop plantations in Africa and build new plants in eastern Europe.
Despite the high leverage of all companies, we believe that it is not a concern as palm oil is a cash-generative business. This coupled with rising CPO prices mean that the four plantation companies in this report are expected to enjoy bumper cashflows this year. Net gearing of the four companies are also envisaged to be comfortable, at a maximum level of 70% for Wilmar.
COMPARISONS ON MARKET REACH
We believe that Wilmar has the widest market reach among the four companies. In our view, Wilmar is most global player in the agribusiness compared to its peers. Although about 45%-50% of Wilmar’s pre-tax profits are derived from China, Wilmar also has a presence in faraway countries like Africa and Russia. Although earnings contribution from these two places are still insignificant, Wilmar sees these two continents as the next growth areas because of their growing population and developing economies.
To recap, Wilmar has a 50/50 joint venture with Olam International Ltd in Africa. The joint venture has investments in SIFCA, which is one of the largest agribusiness companies in the country and two of SIFCA’s palm oil subsidiaries. In Russia, Wilmar in involved in a joint venture with Nizhny Novgorod Fats and Oils Group and Delta Exports Pte Ltd.
Interestingly, IOI prefers to concentrate on developed markets instead of developing markets. Hence, IOI’s global exposure is mainly to US, Europe and Japan. Apart from higher pricing premium command by these markets, IOI’s preference for these countries is also because they are better paymasters.


Although Sime Darby has overseas operations in places like China (mainly motor division) and Africa (refining), we reckon that overseas earnings contribution is still insignificant. Although Sime did not disclose the geographical breakdown of its turnover ,we believe that most of the group’s turnover are from Malaysia and Indonesia as 70%-75% of the group’s profits are from the plantation division.
Indofood is largely domestic-centric. Almost 80%-90% of its palm oil are sold internally to the group’s cooking oil division. Indofood’s largest overseas exposure is its commodities division, which sells coconut oil in Philippines.
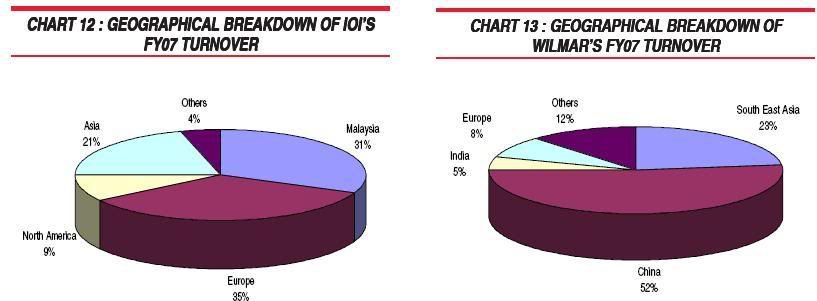
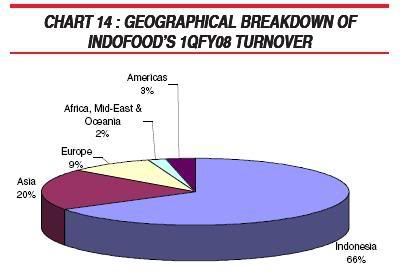
Based on geographical breakdown, about 55% of Wilmar’s FY07 turnover were from China and 25%, from South-East Asian countries like Malaysia and Indonesia (please refer to Chart 13). Approximately 34% of IOI’s revenue in FY07 were from Europe and 31% from Malaysia. North America accounted for 9% of IOI’s FY07 turnover (please refer to Chart 12). As for Indofood, Indonesia accounted for 66% of the group’s FY07 turnover (please refer to Chart 14).
COMPARISONS ON INTEGRATION OF THE PLANTATION BUSINESS MODEL
The most integrated among the four plantation companies is Wilmar. The group is involved in almost every segment of the value chain from upstream to downstream. Wilmar even has its own fertiliser and vessels to ship its products.
The benefits of integration is the derivation of cost savings of US$1-2/tonne from every segment of the plantation chain. For instance, having own vessels to ship products ensures timely shipments and reduces delays.
Wilmar has 19 vessels and approximately 25%-30% of its products are shipped using its own vessels. Wilmar’s fertiliser plant has production capacity of 450,000 tonnes/ year.
Wilmar has ventured further down the plantation value chain by building flour and rice milling plants in China. The flour milling plant has production capacity of 1.5m tonnes/ year while the rice milling plant’s production capacity is about 300,000 tonnes/year. Wilmar’s rationale for venturing into flour and rice is because they are still somewhat related to the group’s products. For instance, cooking oil is used to fry instant noodles, which are produced using flour.
The second most integrated plantation company is IOI. Apart from the upstream division, IOI’s operations in the refining, oleochemical and specialty fats segments are also sizeable. Currently, more than one-half of the group’s CPO are being used internally in the downstream segments.
However, apart from these three downstream segments, IOI has been quite conservative in the direction of its business. Unlike the other plantation companies, it has never ventured into biodiesel, which is good since biodiesel is currently unprofitable nor has IOI ventured into other agricultural products. Although IOI recently said that it would be building a margarine plant in Rotterdam, this is related to its existing business activities. Specialty fats products are used as inputs to make margarine.
Indofood is not as integrated as Wilmar or IOI. However, the interesting thing about Indofood is that it recently proposed to acquire a 60% equity interest for S$56m in a company, which has 37,500 ha of land allocated for sugar cane plantations. The group is venturing into the sugar business in view of the industry’s good outlook. Sugar prices are expected to remain high underpinned by demand from the food segment and ethanol producers.
The least integrated is Sime Darby. Apart from plantations, the group is also involved in businesses like motor, power and heavy equipment, which are unrelated to each other.

CONCLUSION
In summary, we find that IOI is the best in the upstream palm oil business due to its consistently high FFB yields and efficient operations. In oleochemical and specialty fats, we prefer IOI to Wilmar due to its exposure to growth opportunities offered in USA and Europe.
However, in terms of market reach, we like Wilmar. We believe that Wilmar has the potential to become a global player in the agribusiness like its shareholder, Archer Daniels Midlands. Wilmar is also the undisputed leader in the vegetable oil processing business i.e. palm oil refining and soybean crushing and refining.
Among the four companies, Sime Darby offers the most attractive dividend yield. The group’s dividend payout policy is expected to be consistently high for the benefit of its major shareholder, PNB.
Overall, we find that IOI is the most active in capital management. Over the past couple of years, IOI has undertaken a capital repayment, increase its dividend payments, carried out a share split, bought back and cancelled its shares.
Indofood is the best in cooking oil in Indonesia because of its leadership and large market share. Through LonSum, Indofood would also have access to good quality and highyielding oil palm seedlings. LonSum’s seedlings are reputed to be among the best in the world.
We maintain our Buy recommendations on the four plantation companies as each has its own strengths and field of competency. Each company also offers investors different kinds of exposure within the plantation sector. Finally, during times of uncertainties, the four companies are a safe haven with minimal earnings risk and steady cashflows underpinned by healthy CPO prices.


amresearch Plant080620.pdf

29 June 2008

棕仁油飆漲‧料納入暴利稅行列‧種植公司財測維持 不同策略護盤 四大種植公司風險不一

棕仁油飆漲‧料納入暴利稅行列‧種植公司財測維持
大馬財經 行業快門 2008-06-21 11:31

(吉隆坡)價格飆升的棕仁油步原棕油後塵,加入種植領域暴利稅行列,對種植領域是雪上加霜,但分析員認為,市場供應吃緊、美國潮濕氣候、高油價等因素,原棕油前景持續正面,有助緩和衝擊,維持種植領域“加碼”評級。

根據暴利稅法令,從7月1日起,暴利稅機制將取代原有的食品油津貼機制(COSS),並依據大馬棕油局平均原棕油售價,各別向東馬和半島州屬,每公噸價格超過2000令吉的原棕油和棕仁油,徵收7.5%和15%稅務。

聯昌研究指出,原有的食品油津貼機制並不包括種植面積少於40公頃的種植業者,政府通過落實涵蓋面較廣的暴利稅機制,並將近期價格飆漲的棕仁油納入其中,預計徵收的稅金所得,將較COSS高出近13%,達到29億令吉目標。

14億稅金津貼食品油

“我們預計稅金所得的14億令吉,將用來津貼每月平均7萬公噸的食品油用量,餘額則充作其他食品津貼和政府開銷。”

儘管棕仁油也難逃暴利稅,但預計新措施將對東馬種植業者有利,對在半島擁有大片種植面積的業者則是負面消息。

若原棕油價格達每公噸3350令吉水平,東馬種植業者將可節省2.0%稅務,相反半島業者則需負擔額外1.5%稅務,較先前預測的0.5%高,估計種植公司盈利將受衝擊,幅度介於下滑0.3%至上揚1.8%之間。

相關稅務較預期來得負面,但聯昌認為,這有助市場釐清真相,且對種植公司盈利衝擊不大,加上市場供應吃緊、油價高漲,以及美國潮濕氣候,令大豆種植受到影響,料積極推動原棕油價格走揚,前景依舊良好,維持各大種植公司盈利預測。

不同策略護盤
四大種植公司風險不一

大馬研究預計,上遊和下游領域賺益持續走揚,加上原棕油產量和併購成長帶動,盈利成長集中,唱好原棕油領域前景,維持2008和2009每公噸原棕油平均售價3500令吉目標。

儘管原棕油前景看好,但全球四大種植公司均採用不同的護盤策略,風險程度也各不相同,其中IOI集團(IOICORP,1961,主板種植組)採用預售3個月產量方式,而森那美(SIME,4197,主板貿服組)則是以1+2個月進行期貨交易。

新加坡豐益國際(Wilmar International)和印多福農業(Indofood Agri)則是根據市況和現月貨進行交易。

分析員認為,豐益國際的護盤策略最好,在原棕油價格年初上抵每公噸4000令吉價位時,便對原棕油價格感到憂慮,並預售2008財政年半數產量。在產量方面,IOI集團純鮮果串產量達到每公頃26至28公噸,加上低於市場平均的營運成本,無疑是這環節最大贏家。

但隨著現處於黃金週期的果樹樹齡漸老,以及印尼貢獻尚未顯著,在未來3至5年,新加坡豐益國際和印多福農業將取代IOI集團崛起成為強者,主要是他們的果樹組合平均樹齡尚淺,強勁產能可期。

豐益國際和印多福農業2008至2011財政年鮮果串複合成長率(CAGR)各別將達到7%,IOI集團和森那美則為2%和1%。

此外,豐益國際和印多福農業也是最積極購置地庫的公司,雙雙通過併購其他業者,擴大旗下種植面積。

雖然IOI集團在上遊的擴充計劃不如豐益國際和印多福農業般積極,但該公司正慢慢透過荷蘭鹿特丹的洛德斯克羅科蘭(Loders Croklaan),在美國和歐洲食品領域佔據一席位,並宣佈計劃投資2億美元在美國和歐洲興建新廠房。

豐益國際憑藉其在大馬、印尼和中國的龐大經濟規模,加上在原產品市場的良好判斷紀錄,料是其中最大受益者。不過,IOI集團在特殊油脂領域處在良好位置,有望從中“卡位”爭取成長機會。

大馬研究表示,雖然通膨壓力令人憂慮,但原棕油現較大豆油便宜17至19%,料可從食品公司可能轉向採用更廉價的食品油中獲益。

IOI上游領域具優勢

總結4家種植公司,大馬研究認為,IOI集團在鮮果串產量以及營運效益均比其他公司來得好,上游領域最具優勢;過去數年持續提高派息率,並落實資本回退、拆細股票、股票回購等計劃,在資本管理方面最具效率,但未來資本管理空間有限,主要是公司保留銀彈充作業務擴充用途。

森那美派息具吸引力

森那美則擁有最具吸引力的派息政策,主要歸功於公司大股東國民投資公司(PNB)鼓勵公司積極回退資金。

豐益國際市場延伸能力最強,印多福農業則憑藉其市場領導地位,以及龐大的市佔率,在印尼食品油市場最吃得開。
星洲日報/財經‧2008.06.21

21 May 2008

hap seng plantation quarter report


本季的成绩,创下惊人跌幅,原因有4,亦即
1.为了配合31/12 ending fiscal year,本季只记两月份;
2.雨季影响收成;
3.8000公顿cpo的存货增加;
4.一如既往低于市价的cpo卖价(原本就预料的)。

Resulting from the change in financial year end as mentioned in Part A Note 2, the current quarter results was for the two months period ended 31 March 2008.
For the current period under review, the Group recorded revenue of RM45.8 million on Crude Palm Oil (CPO) sales volume of 13,252 tonnes and Palm Kernel (PK) sales volume of 4,906 tonnes. Average selling price of CPO and PK achieved were RM2,431 and RM1,995 per tonne respectively.
Generally, Group’s revenue was affected by lower CPO sales volume due to lower production of Fresh Fruit Bunches (FFB) attributable to the seasonal yield trend and changes in cropping pattern as well as delay in deliveries of CPO resulting from the wet weather conditions during the period under review. Consequent to the delay in deliveries of CPO, closing stock of CPO as at 31 March 2008 has increased by approximately 8,000 tonnes as compared to 31 January 2008.
Overall. the Group’s Profit before tax and Profit after tax for the current period was RM17.6 million and RM13.2 million respectively.
Earnings per share (EPS) attributable to the shareholders of the Company for the current period was 1.65 sen.

Group profit before tax for the current quarter at RM17.6 million was 76% lower than the preceding quarter of RM73.5 million. The lower results were mainly attributable to only two months reporting in the current quarter, lower FFB production attributable to the seasonal yield trend and changes in cropping pattern, and lower CPO sales volume due to delay in deliveries resulting from the adverse weather conditions.

对于第四点,hsplant的平均卖价为2431,目前为止的资料为swkplnt报3033,bstead报3029。可见forward sales的杀伤力。

至于hsplant少计算了多少盈利呢?这可以从存货的上升计算。前后二月存货增加了RM5758000,如果换算成税前盈利,应该是8000*(2431-720) = RM13688000。
平均成本是RM720,已经够低了,所以不可能连pk也卖不出,pk不加进。
不肯定此项预测,会不会遭受forward sales鬼合约扭曲?

15 April 2008

hsplant的forward sale


hsplant原本可以无条件成为当红种植股首选,但是董事早在公司收购之初,就迫不及待和别人签定了不公平的远期合约。

如果我没忘,这不平等的合约,定价比当时市价(spot)低上RM600。第二次的合约定价,是在cpo spot RM3000的时候,折扣了RM1000,定在RM2000。

目前hsplant有一半的product,必须以RM2000供应。

没有人傻到出那么低的价钱,这是绝对事实。至于谁是得益者,自己想吧!

但如果投资者抱着吹毛求疵的心态,那么我建议你们不用买股票了(除了少数的大众银行),我们必须承认现实。

hsplant的yield是全马第二高的,也是成本最低之一的种植地。
他的种植地几乎可说只有一块(one lump area),坐落在sabah州,另一个块也是坐落在sabah,但不在此one lump area。
hsplant可以享有低廉的成本,那是因为有条河流贯穿了这片土地,大大省却了灌溉的问题。此外,hsplant采用了水运输送棕果,到自己的提炼厂,这也省去了山地运载的麻烦。
他们有三座提炼厂,都坐落在这块地的范围内,他们能够很迅速的提炼采收来的棕果。

hsplant本益比可以达到7倍水平,他的派息率也有50%的水平,在成本和运作方面已经超越了国内任何同业,除了IOI。
他的股价这么低,ipo卖得那么便宜,绝对有什么内幕是外人无法挖掘的。

forward contract

A forward contract is an agreement between two parties to buy or sell an asset (which can be of any kind) at a pre-agreed future point in time. Therefore, the trade date and delivery date are separated. It is used to control and hedge risk, for example currency exposure risk (e.g., forward contracts on USD or EUR) or commodity prices (e.g., forward contracts on oil).

One party agrees (obligated) to sell, the other to buy, for a forward price agreed in advance. In a forward transaction, no actual cash changes hands. If the transaction is collateralized, exchange of margin will take place according to a pre-agreed rule or schedule. Otherwise no asset of any kind actually changes hands, until the maturity of the contract.

The forward price of such a contract is commonly contrasted with the spot price, which is the price at which the asset changes hands (on the spot date, usually two business days). The difference between the spot and the forward price is the forward premium or forward discount.

A standardized forward contract that is traded on an exchange is called a futures contract.